HQTUI — High Quality Terminal UI for TypeScript, Rust, Go, Python, Zig and C++
High Quality Terminal UI for TypeScript, Rust, Go, Python, Zig and C++
v0.10.3 · 11 language demos · MITTerminal dashboards thatlook like they took months
btop-grade dashboards with a one-import API. Own the terminal directly, render only what changed, and make beautiful graphics a first-class primitive.
New: native Rust, Go, Python and Zig ports New: 370 icons and 3,963 emoji, built in
 See it running, right now
curl -fsSL https://hqtui.com/demo.sh | sh -s -- --system typescript
Or add it to your project
bun add @profullstack/hqtui
Or install the CLI
curl -fsSL https://hqtui.com/install.sh | sh

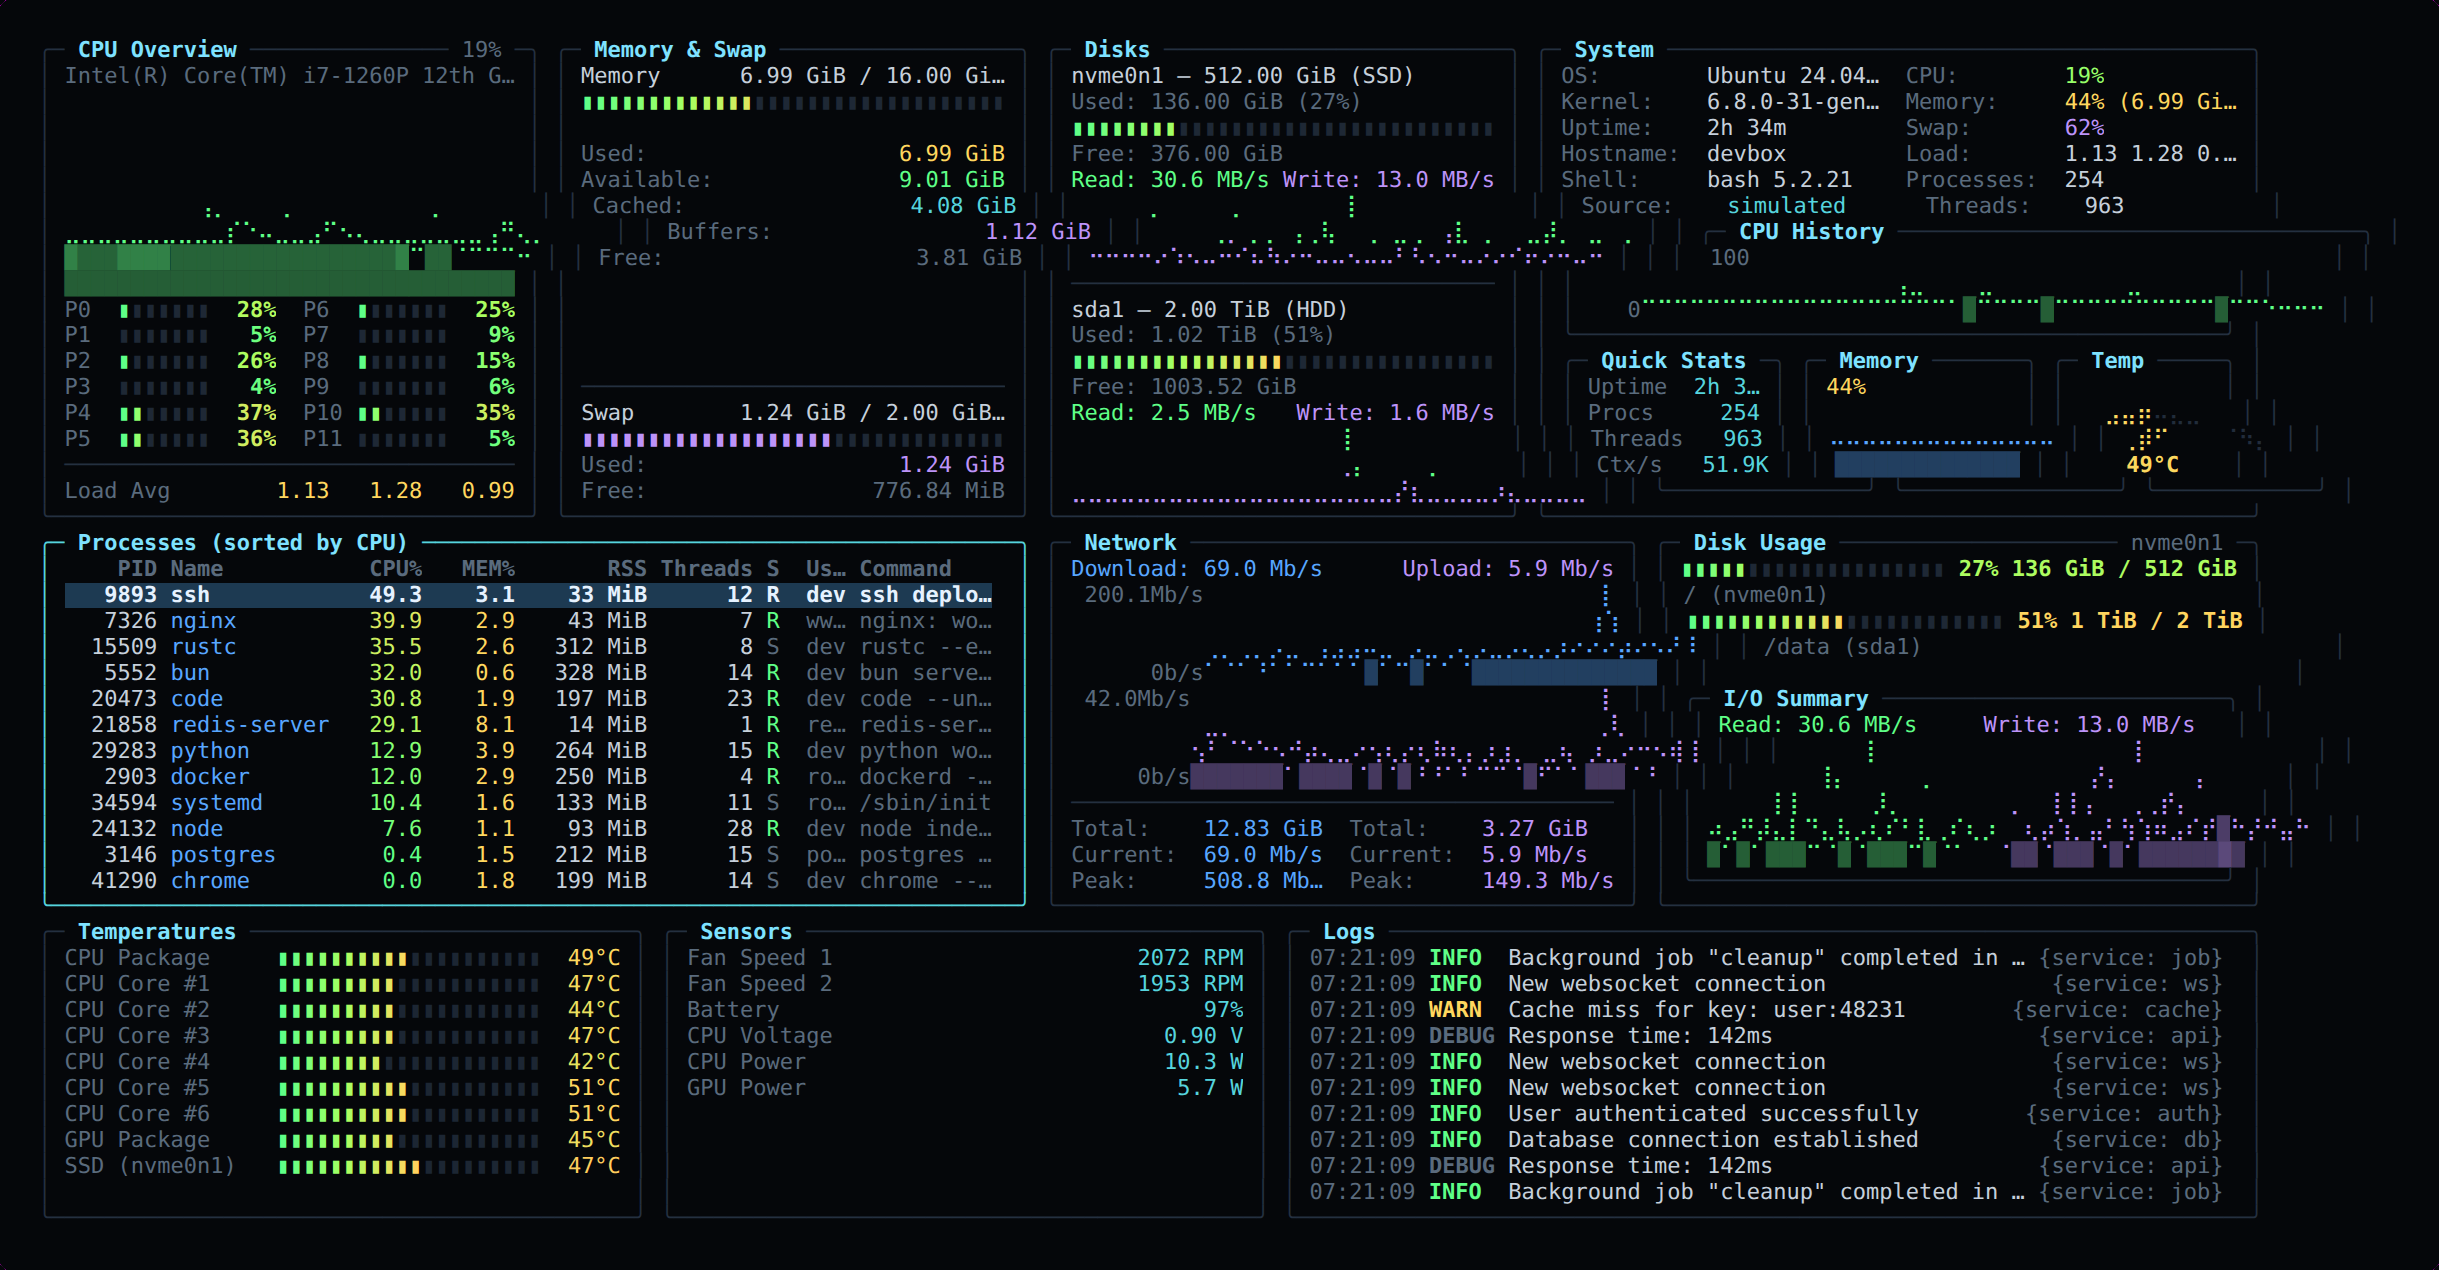
A screenshot of hqtui-demo on a laptop, reading its own sensors. Not a mockup.
One terminal UI, eleven language demos
Build in TypeScript or use a native Rust, Go, Python or Zig implementation. C++ now has a native ten-screen demo over the shared C rendering core, with an experimental library API. Ruby, PHP and Perl add experimental bindings to that same engine, with APIs for your own CLI applications. COBOL links against nothing at all: it writes fixed-width records that an adapter renders, which is how a language with no binding can still draw a Braille chart. The native demos need no JavaScript runtime.
Every command checks latest main, builds in a private cache, and runs it. No manual clone or pull. Vanilla uses your installed toolchain; mise uses the pinned toolchain. C++ uses pinned CMake with your installed GCC/Clang. Git and curl are required; the first build takes longer.
Ruby
Ruby bindings with a batched widget API. The shared C/C++ demo engine runs inside your language runtime; not an independent port.
curl -fsSL https://hqtui.com/demo.sh | sh -s -- --system ruby
curl -fsSL https://hqtui.com/demo.sh | sh -s -- --mise ruby
Interactive — press q to quit, or add --snapshot for headless output.
Get startedPHP
PHP bindings with a batched widget API. The shared C/C++ demo engine runs inside your language runtime; not an independent port.
curl -fsSL https://hqtui.com/demo.sh | sh -s -- --system php
curl -fsSL https://hqtui.com/demo.sh | sh -s -- --mise php
Interactive — press q to quit, or add --snapshot for headless output.
Get startedPerl
Perl bindings with a batched widget API. The shared C/C++ demo engine runs inside your language runtime; not an independent port.
curl -fsSL https://hqtui.com/demo.sh | sh -s -- --system perl
curl -fsSL https://hqtui.com/demo.sh | sh -s -- --mise perl
Interactive — press q to quit, or add --snapshot for headless output.
Get startedNim
Nim bindings with a batched widget API. The shared C/C++ demo engine runs inside your language runtime; not an independent port.
curl -fsSL https://hqtui.com/demo.sh | sh -s -- --system nim
curl -fsSL https://hqtui.com/demo.sh | sh -s -- --mise nim
Interactive — press q to quit, or add --snapshot for headless output.
Get startedC++
Native C++17 demo over the shared C renderer. Experimental library API; requires GCC/Clang and CMake.
curl -fsSL https://hqtui.com/demo.sh | sh -s -- --system cpp
curl -fsSL https://hqtui.com/demo.sh | sh -s -- --mise cpp
Interactive — press q to quit, or add --snapshot for headless output.
Get startedTypeScript
The reference implementation. Runs on Bun, Node and Deno.
curl -fsSL https://hqtui.com/demo.sh | sh -s -- --system typescript
curl -fsSL https://hqtui.com/demo.sh | sh -s -- --mise typescript --sim
Latest source, built with Bun. Interactive — press q to quit.
Get startedRust
Native Rust with explicit ownership and interaction IDs.
curl -fsSL https://hqtui.com/demo.sh | sh -s -- --system rust
curl -fsSL https://hqtui.com/demo.sh | sh -s -- --mise rust
Interactive — press q to quit, or add --snapshot for headless output.
Get startedGo
Native Go with callbacks that close over your application state.
curl -fsSL https://hqtui.com/demo.sh | sh -s -- --system go
curl -fsSL https://hqtui.com/demo.sh | sh -s -- --mise go
Interactive — press q to quit, or add --snapshot for headless output.
Get startedPython
Native Python with callbacks and compact array-backed cell storage.
curl -fsSL https://hqtui.com/demo.sh | sh -s -- --system python
curl -fsSL https://hqtui.com/demo.sh | sh -s -- --mise python
Interactive — press q to quit, or add --snapshot for headless output.
Get startedZig
Native Zig 0.16 with explicit context and arena-managed frames.
curl -fsSL https://hqtui.com/demo.sh | sh -s -- --system zig
curl -fsSL https://hqtui.com/demo.sh | sh -s -- --mise zig
Interactive — press q to quit, or add --snapshot for headless output.
Get startedCOBOL
Writes 80-column records that a TypeScript or Rust adapter renders. Needs GnuCOBOL; there is no mise package for it, so this one is --system only.
curl -fsSL https://hqtui.com/demo.sh | sh -s -- --system cobol
curl -fsSL https://hqtui.com/demo.sh | sh -s -- --system cobol
Latest source, built with Bun. Interactive — press q to quit.
Get startedShared conformance fixtures check cells, colors and escape bytes across implementations. Read the launch article.
Start with TypeScript
createApp() already gives you a dark theme, truecolor with automatic fallback, mouse tracking, the alternate screen, resize handling, adaptive frame pacing, and a terminal that is restored no matter how your process dies.
- No configuration required to look good
- 30 fps adaptive, 15 fps over SSH, 0 fps when idle
- Degrades to 256/16 colours and ASCII automatically
import { createApp } from "@profullstack/hqtui";

const app = await createApp();

app.render(({ ui }) => {
  ui.panel({ title: "Hello" }, (panel) => {
    panel.text("Hello, terminal.");
  });
});

await app.start();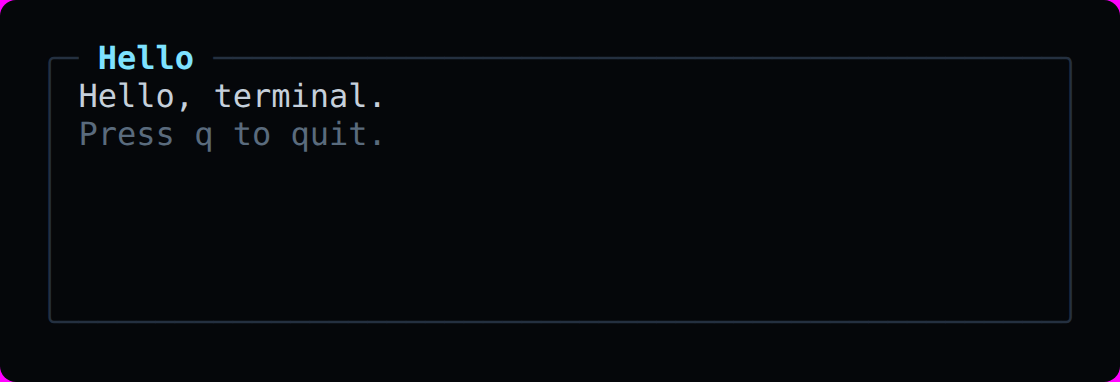
Everything a dashboard needs
The rendering pipeline is deliberately simple: application state, layout, widgets, framebuffer, diff, batched output. Nothing in between.
Thirty widgets, one API
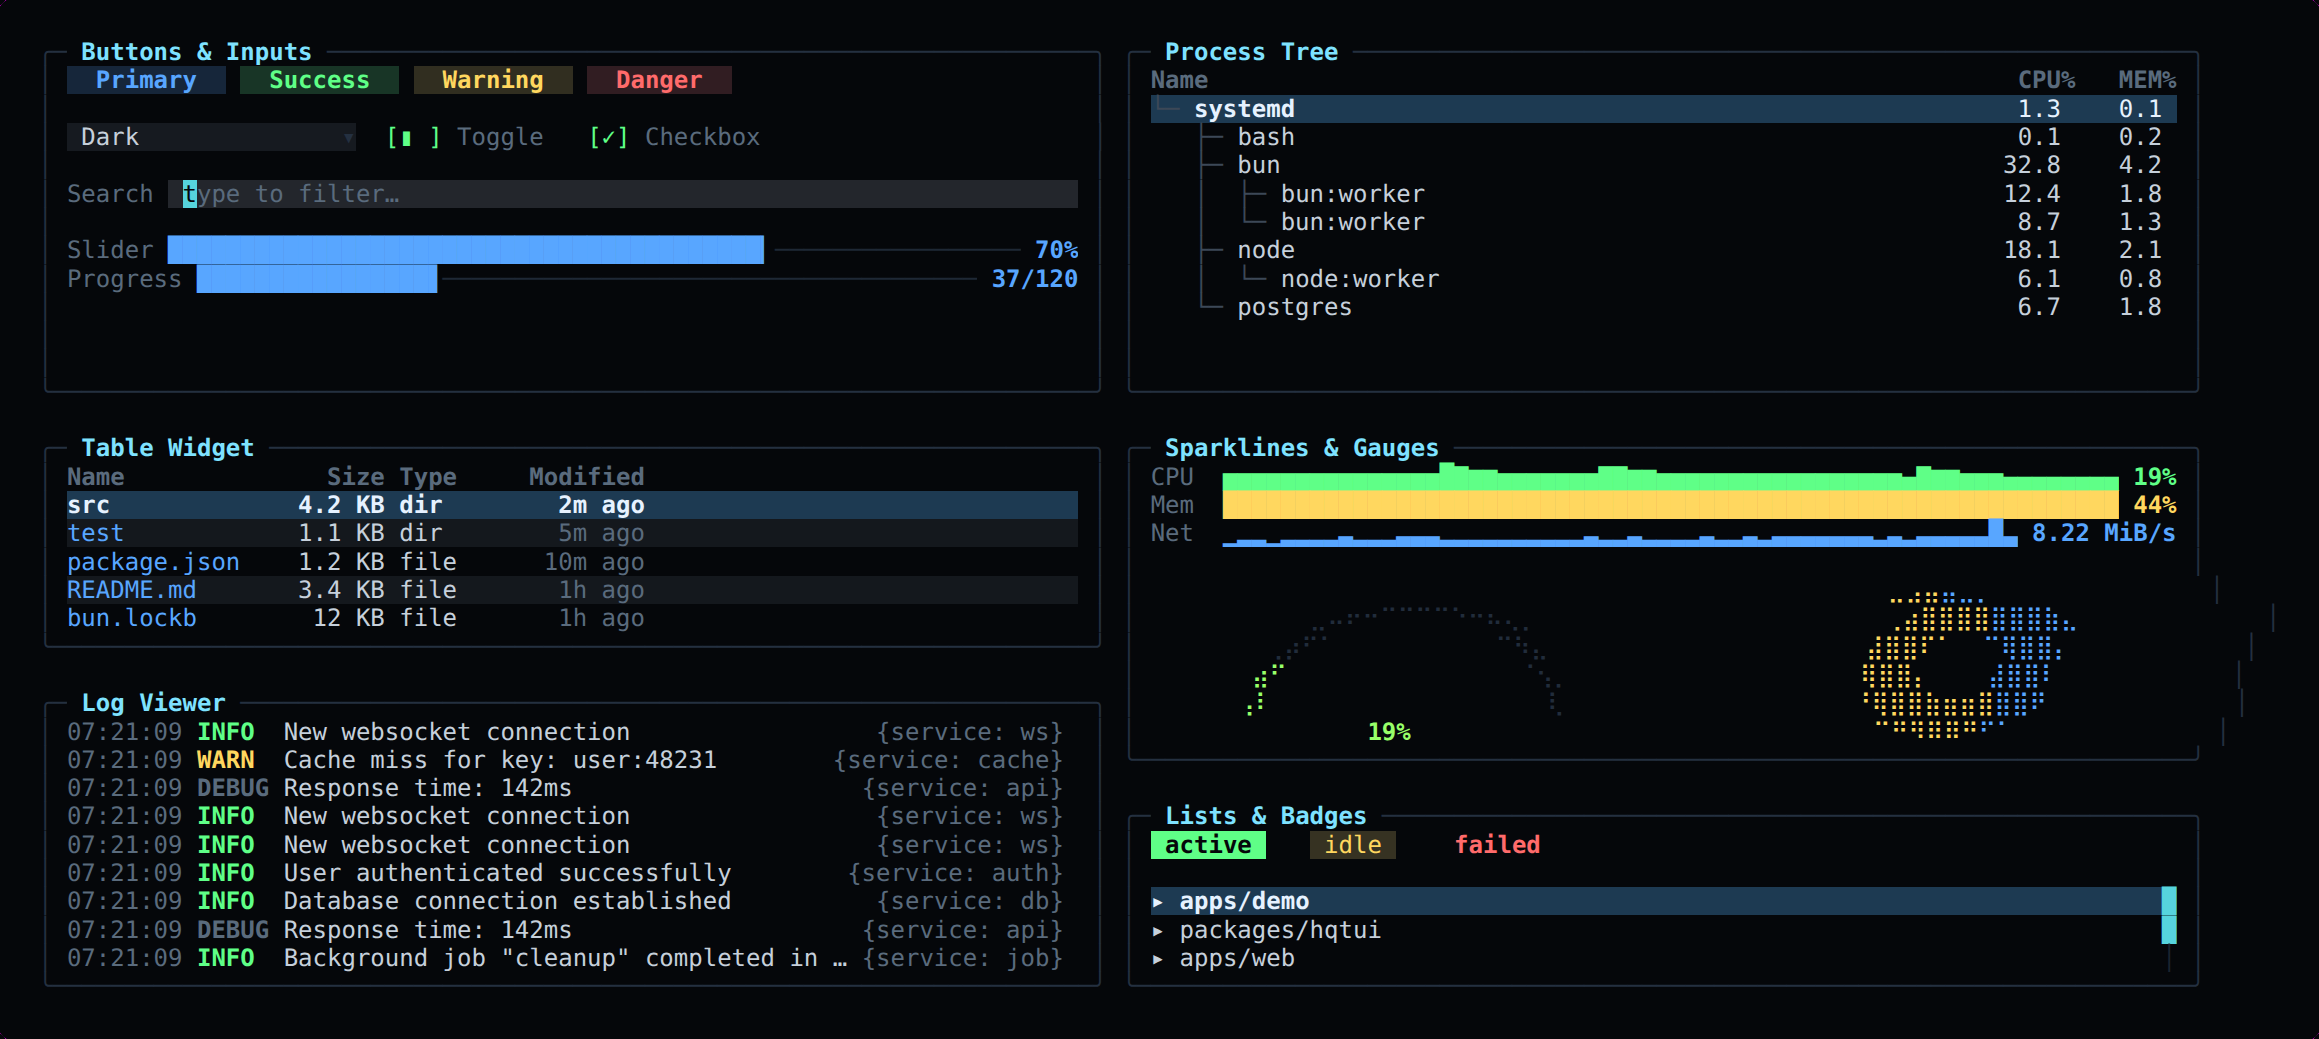
Panels, tables, trees, logs, meters, gauges, donuts, sparklines, graphs, tabs, modals, command palettes and every input control — all sized by the same layout engine, all themeable, all testable.
Icons and emoji, built in
370 icons and 3,963 emoji ship with HQTUI and are on by default. Each draws the best thing your terminal can show: a Nerd Font glyph, a Unicode symbol, or plain ASCII, so a status bar never turns into boxes over SSH.
OpenIcon 370 icons
the spec| icon() | Nerd Font | Unicode | ASCII |
|---|---|---|---|
| "mail" | | ✉ | @ |
| "phone" | | ☎ | tel |
| "link" | | 🔗 | ~ |
| "search" | | 🔍 | ? |
| "settings" | | ⚙ | * |
| "terminal" | | ⌨ | >_ |
| "git-branch" | | ⎇ | Y |
| "bell" | | 🔔 | (!) |
Simple
HQ












OpenEmoji 3,963 emoji
the spec














| emoji() | emoji mode | text mode |
|---|---|---|
| "fire" | 🔥 | [fire] |
| "smile" | 😄 | :D |
| "heart" | ❤️ | <3 |
| "+1" | 👍 | +1 |
Put the OpenEmoji artwork in the terminal itself: install the colour font and point fontconfig, Kitty or WezTerm at it. Kitty, Ghostty, iTerm2 and WezTerm can also draw the high-resolution PNGs inline.
bunx @profullstack/hqtui fonts install
import { icon, emoji, emojify } from "@profullstack/hqtui";

icon("mail");      // the Nerd Font glyph, "✉" in Unicode, "@" in ASCII
icon("github");    // brands too: Nerd glyph, "🐙", "gh"

emoji("rocket");   // "🚀", or "[rocket]" where emoji cannot render
emoji("+1");       // aliases and shortcodes: "👍"
emojify("ship it :oe_rocket: :fire:");
Two open specs, one import
Both sets follow open specifications on LogicSRC, so a set someone else draws works with the same calls. The same functions exist in the Go, Python and Rust ports.
- OpenIcon spec
An icon set as a folder, with three terminal glyphs per icon
- OpenEmoji spec
An emoji set as a folder that says what drew it
- All 370 icons
Search, filter, Simple and HQ, Nerd/Unicode/ASCII views
- All 3,963 emoji
Search, skin tones, and install packs for 22 networks
- API docs: icons and emoji. Sets: openicon, openemoji.
Dark by default
Nine themes ship in the box, and every one of these previews is a live frame from the renderer. Vote for your favourite — the tally lives in SQLite.
Fast by construction
The screen is one grid of cells in four typed arrays. Nothing allocates per cell in a hot path. Frames are diffed and only the changed runs are written, merged across short clean gaps because rewriting five cells is cheaper than an escape sequence.
Changing CPU 72% to CPU 73% writes a single character.
160x50 (8,000 cells) · bun 1.4 · linux x64 · reproduce with bun run bench
| Benchmark | Mean | Output |
|---|---|---|
| Idle frame (0% changed) | 0.068 ms | no output written |
| 1% of cells changed | 0.140 ms | 627 bytes/frame |
| 10% of cells changed | 0.291 ms | 2,639 bytes/frame |
| 50% of cells changed | 0.904 ms | 8,253 bytes/frame |
| Full 160x50 repaint | 0.393 ms | 8,000 cells |
| Six-panel dashboard build | 0.425 ms | layout + widgets + diff |
Run it on your machine
The reference dashboard reads real metrics on Linux, macOS and Windows with no native dependencies, or runs a deterministic simulation so screenshots and benchmarks are reproducible.
curl -fsSL https://hqtui.com/demo.sh | sh -s -- --system typescript
curl -fsSL https://hqtui.com/demo.sh | sh -s -- --system typescript --sim
Ten screens: dashboard, sessions, network, traffic, services, components, graphics, themes, input visualizer, stress test.